Measured vs. Estimated:A GEO Prioritization Model That Shows Its Work
Fifteen tracked AI prompts, scored twice. What the tracking layer measured, what I judged, and what to do when a source you do not own controls the answer.
Every GEO priority score is part measurement and part judgment. Averaging them into one number makes the judgment half invisible, and teams then act on it as if it were data.
This page keeps them apart, scores all 15 tracked prompts, and ends with the part most prioritization frameworks skip: what to actually do when the answer belongs to a page you will never own.
Who this is for: SEO, GEO, and AEO practitioners who have to defend a content roadmap to stakeholders, and marketing leaders who want to know which half of a priority score they are trusting.
Note: Measured columns come from Otterly.AI, United States, across a fixed 15-prompt library, comparing the Week 1 window (June 12 to 18, 2026) with the Week 4 window (July 3 to 9, 2026). Estimated columns are my judgment, labeled as judgment, with the basis stated. No revenue data was available for Cloudflare, which is the point.
The problem with a single priority score
Run a citation gap audit and you get a list. Every row looks like a problem. To make it actionable, most practitioners collapse it into a priority score: some weighting of visibility, intent, and revenue proximity, ranked high to low.
Half of that score's inputs are measured. Presence, position, which sources are cited, stability over time. Those are facts a tool produced. The other half is estimated. Buyer stage, purchase intent, how close a prompt sits to revenue, whether an answer is winnable at all. Those are judgment calls a person made.
Averaging them produces one confident-looking number in which nobody can tell which half is which.
This matters more in GEO than in classic SEO, because the estimated half is weaker here. AI-referred traffic is badly instrumented. Much of it lands as direct. Someone who reads an AI answer about a brand on Tuesday and searches that brand on Friday shows up as branded search, not AI influence. Any revenue number attached to a citation gap is an inference and should look like one on the page.
The model: two columns, never combined
The fix is structural, not statistical. Keep measured inputs and estimated inputs in visibly separate columns, label the estimates as estimates, and refuse to produce a composite.
Measured inputs
Everything here comes from the tracking layer. If a tool did not produce it, it does not belong in this group.
| Input | Source | What it tells you |
|---|---|---|
| Brand mentions | Prompt tracking | Whether the brand appears in the answer, and how often |
| Average position | Prompt tracking | Where the brand sits when it does appear |
| Owned citation rate | Prompt citations divided by total citations | How much of the answer the brand's own pages actually supply |
| Answer owner | Prompt citations by URL | Which specific page is shaping the answer |
| Stability | Week-over-week comparison | Whether a gap persists or is noise in a single pull |
Estimated inputs
Everything here is judgment. Each carries a stated basis and a confidence flag, so a reader can disagree with the reasoning rather than the number.
| Input | Basis | Why it is an estimate |
|---|---|---|
| Buyer stage | Prompt language and intent | Inferred from phrasing, not from observed buyer behavior |
| Purchase intent | Prompt language and category norms | A comparison prompt usually signals intent, but not always |
| Revenue proximity | Buyer stage plus intent | AI-referred traffic is poorly attributed, so this cannot be measured directly |
| Displaceability | Who owns the answer and why they win | A judgment about whether an incumbent source can realistically be replaced |
| Confidence | Strength of the above | An explicit signal about how much weight the estimate should carry |
The rule
No composite. The output is a table a person reads, not a number a person sorts by. If a stakeholder wants a ranking, they get one built by hand from both columns, with the reasoning written down.
All 15 prompts, scored both ways
Measured columns are from Otterly.AI. Owned citation rate is Cloudflare-domain citations divided by total citations for that prompt in the Week 4 window. Estimated columns are my judgment.
Group 1: Cited and sourced
The brand is mentioned heavily and its own pages supply a meaningful share of the citations. There is no gap here. The correct action is to protect and monitor, which is worth saying out loud because high-scoring rows attract work they do not need.
| Prompt | Mentions W1 → W4 (M) | Owned citation rate W4 (M) | Revenue proximity (E) | Action |
|---|---|---|---|---|
| Which platform offers unmetered DDoS and global CDN? | 8 → 28 | 18.5% | High, high confidence | Protect and monitor |
| Which Zero Trust service secures employees and SaaS apps? | 6 → 22 | 18.4% | High, high confidence | Protect and monitor |
| Which web application firewalls also include strong DDoS protection? | 8 → 25 | 9.5% | High, medium confidence | Protect and monitor |
| Which enterprise solutions combine CDN, WAF, and DNS together? | 8 → 27 | 8.1% | High, medium confidence | Protect and monitor |
Group 2: Mentioned but not sourced
The brand is named in the answer, often first, while its own pages supply almost none of the citations behind it. Under a composite score these read as healthy, because mentions are high. The owned citation rate is what exposes them.
| Prompt | Mentions W1 → W4 (M) | Owned citation rate W4 (M) | Displaceability (E) | Action |
|---|---|---|---|---|
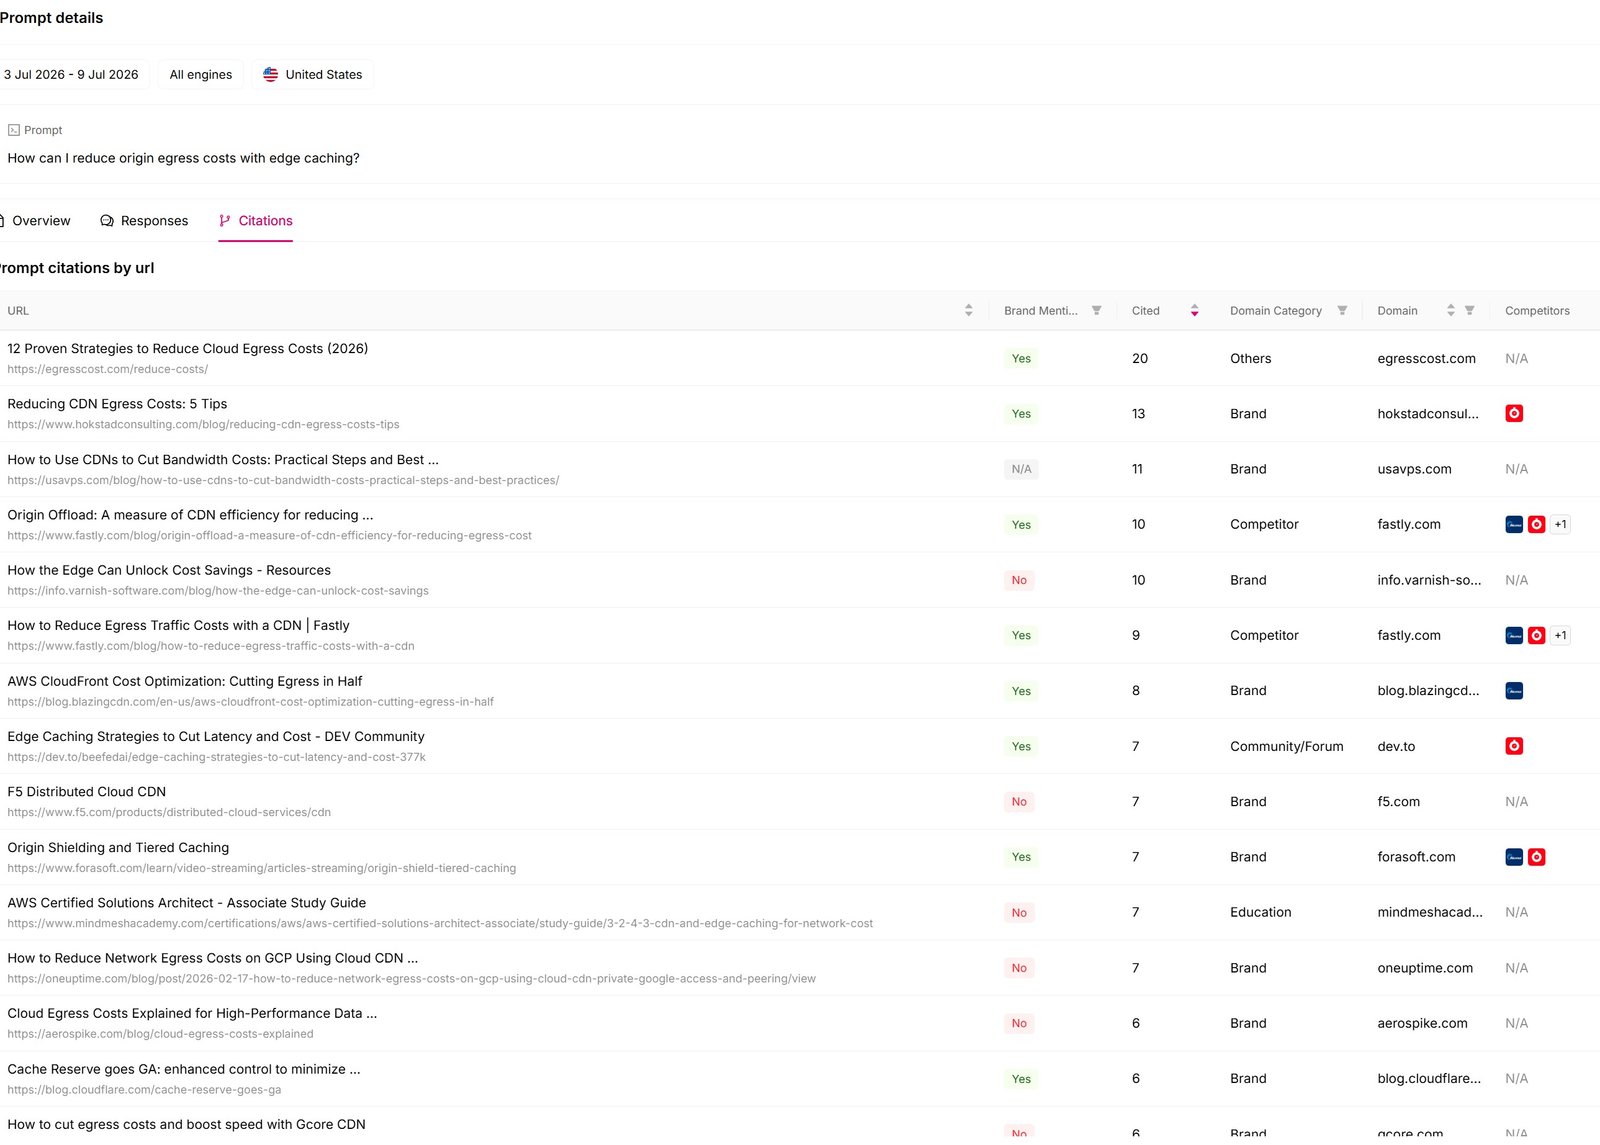
| How can I reduce origin egress costs with edge caching? | 4 → 12 | 1.1% | Low | Distribution and third-party authority |
| What are the best global CDNs for high-traffic sites? | 8 → 27 | 0.7% | Medium | Get into the listicles that own the answer |
| What are the most reliable edge compute platforms for developers? | 8 → 22 | 0.7% | Medium | Get into the listicles that own the answer |
| What platform helps deploy low-latency global applications without servers? | 8 → 25 | 0.8% | Medium | Owned citation rate fell from 12 citations to 2. Investigate first |
| What edge compute platform charges only for CPU time? | 2 → 20 | 0.4% | Medium | Publish the pricing specifics the answer needs |
| How do leading SASE platforms compare on Zero Trust features? | 2 → 17 | 0.6% | Medium | Become the source the comparisons cite |
| How do top Zero Trust access platforms replace legacy VPNs? | 4 → 16 | 1.2% | Medium | Become the source the comparisons cite |
| How do I protect my production apps from massive DDoS? | 6 → 20 | 4.2% | High | Closest to winnable in this group. Start here |
Group 3: Absent
The brand barely appears or does not appear at all. These are the only true content gaps in the set, and only one of them is worth a quarter.
| Prompt | Mentions W1 → W4 (M) | Total citations W4 (M) | Revenue proximity (E) | Action |
|---|---|---|---|---|
| What are the best platforms to secure AI agents? | 2 → 0 | 263 | High, medium confidence | Category entry. The clearest opportunity in the set |
| How can I secure users, devices, and data on one network? | 0 → 0 | 252 | Medium, low confidence | Absent both weeks. Diagnose before committing |
| What should I use if my VPN concentrator is overloaded? | 0 → 3 | 278 | Low, low confidence | Problem-aware, low intent. Low priority |
(M) = measured. (E) = estimated. Owned citation rate = Cloudflare-domain citations ÷ total citations for that prompt, Week 4 window.
What the split actually changes
Case 1: The row a composite score gets wrong
On How can I reduce origin egress costs with edge caching? in Week 4, Cloudflare was mentioned 12 times and ranked first. Under a blended score, that plus a purchase-adjacent prompt puts the row near the top of the list, and a content team writes a page.
The measured column tells a different story. Of the 280 citations behind those answers, Cloudflare's own domain supplied 3. The top cited page was egresscost.com at 20 citations, and two Fastly blog posts contributed 10 and 9. A direct competitor was supplying more than three times the source material Cloudflare was.
Case 2: The row that is genuinely a content gap
On What are the best platforms to secure AI agents? Cloudflare went from 2 mentions in Week 1 to zero in Week 4. Across 263 citations, not one came from a Cloudflare domain. Palo Alto Networks led the source set with a single cyberpedia page at 13 citations, followed by SourceForge, agentsecurity.com, and a string of vendor comparison posts.
Almost every cited page in that set carried no brand mention at all. The category conversation is being written without the brand in it.
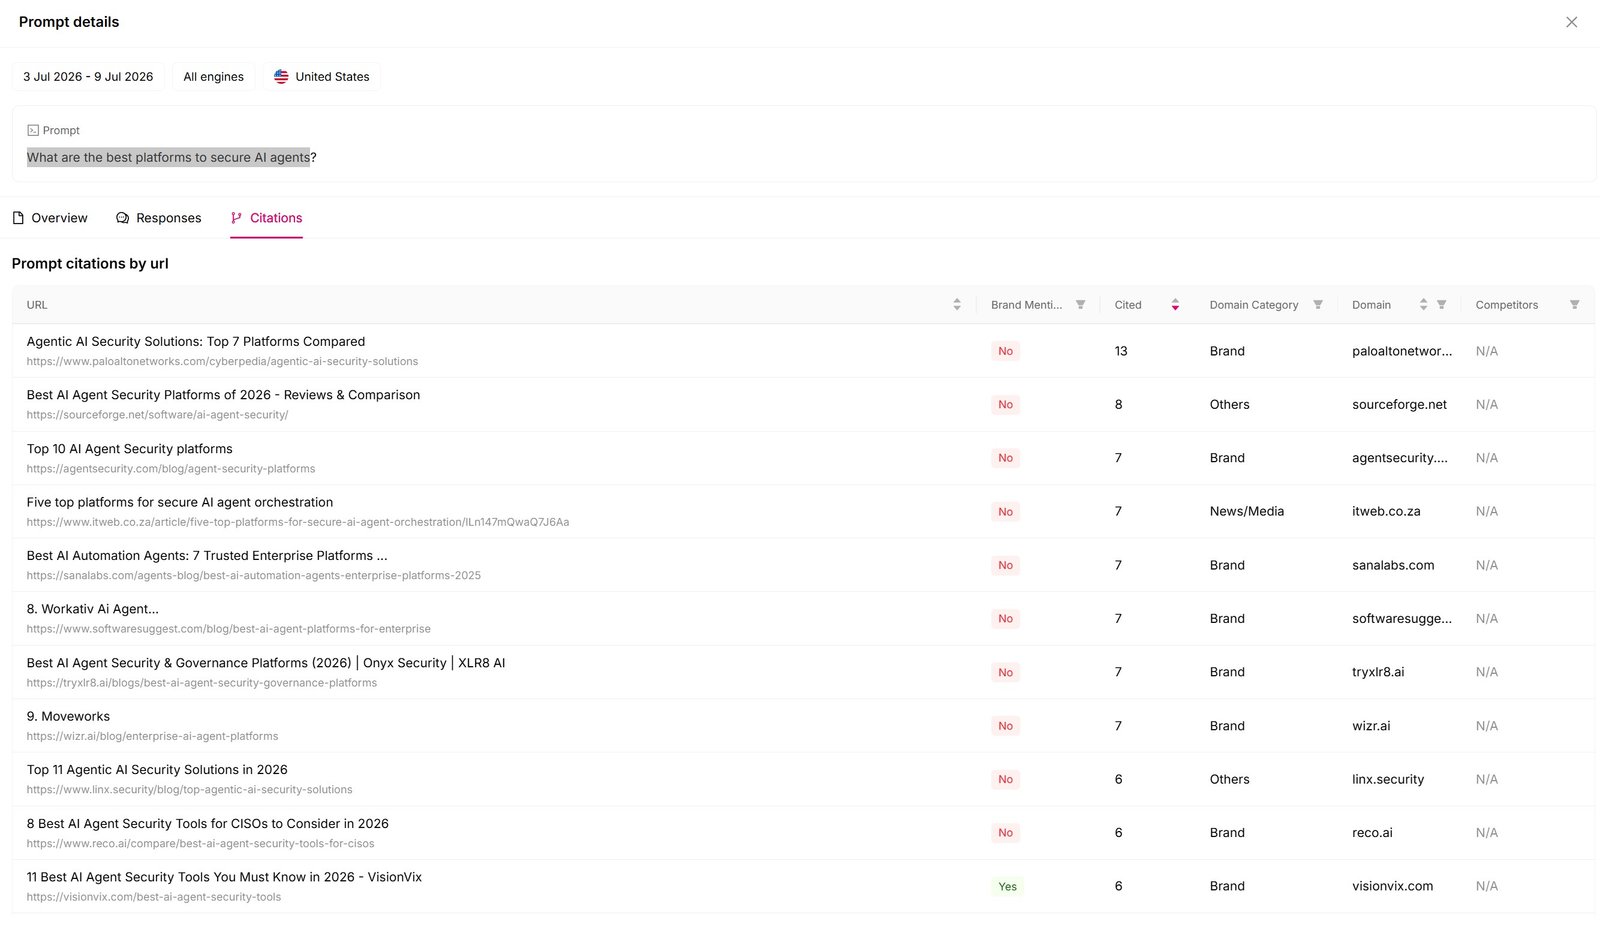
This is the one row in the set where a composite score and the split agree on urgency, and they agree because the measured column is unambiguous: total absence, stable across both weeks, in a category with 263 citations of demand and no dominant incumbent.
Case 3: The row where doing nothing is correct
On Which platform offers unmetered DDoS and global CDN? Cloudflare was mentioned 28 times, ranked first, and its own domain supplied 50 of 270 citations. Five owned URLs appear in the top of the cited set, led by the DDoS for Web product page at 8 citations.
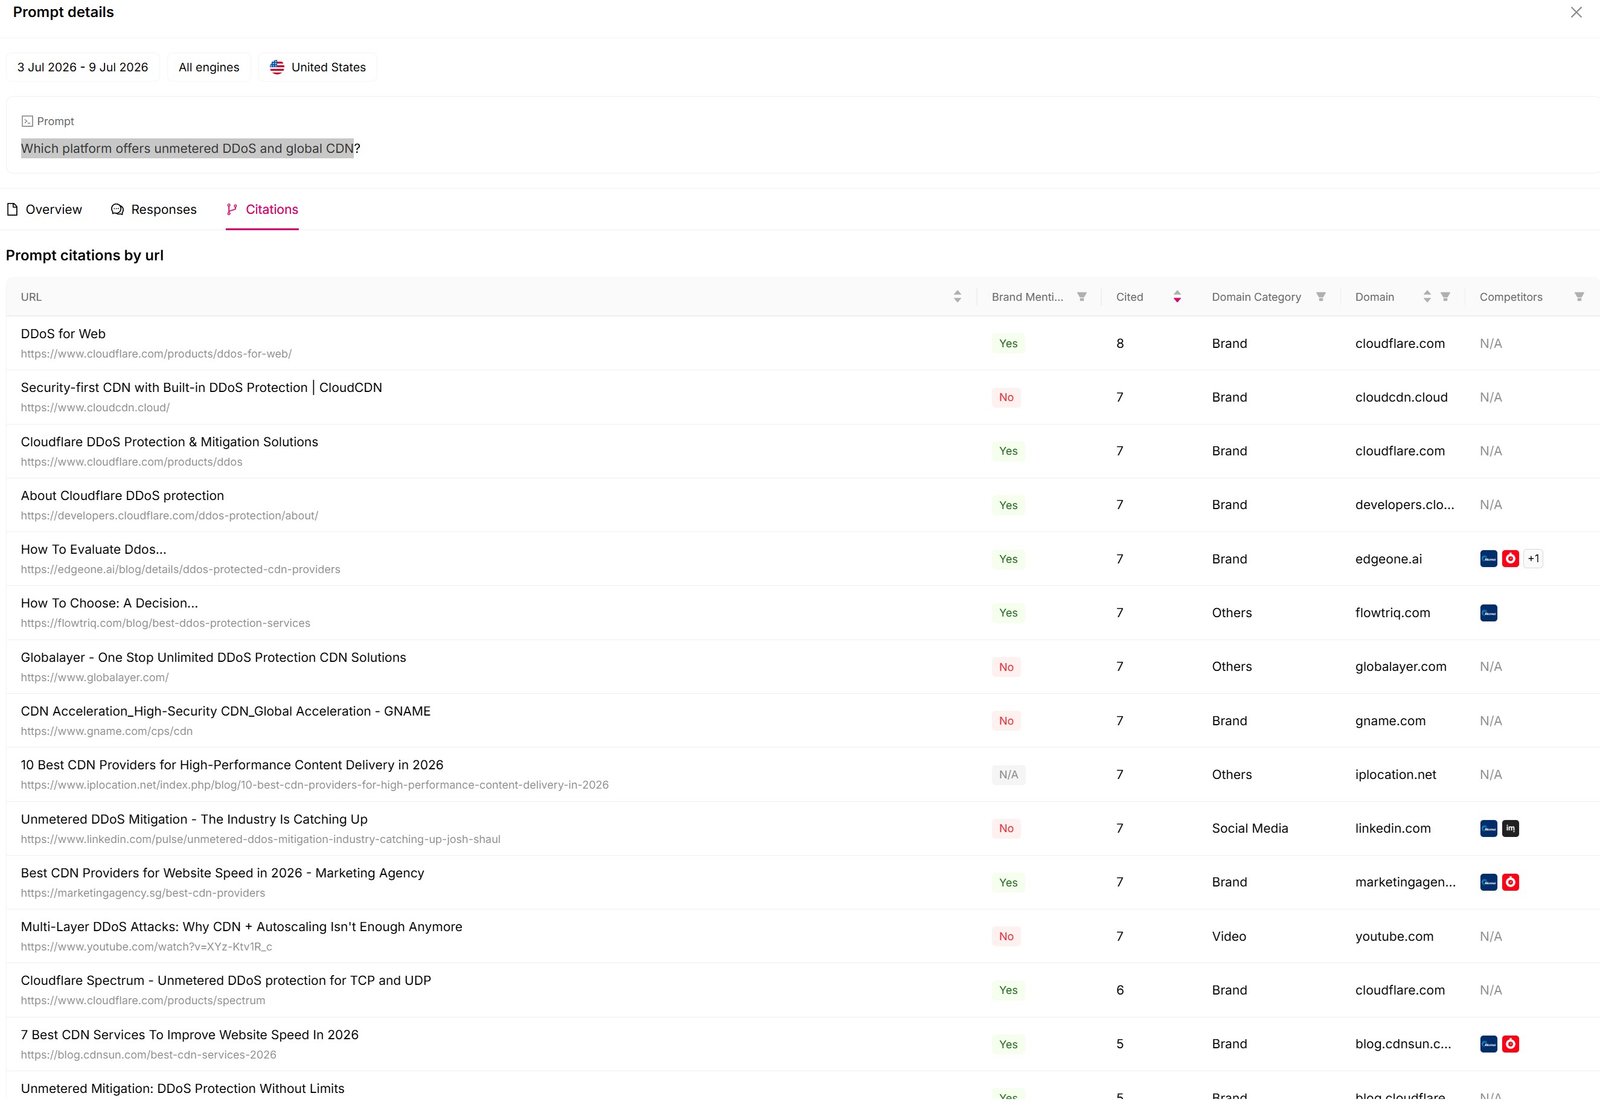
In a ranked list, high scores attract work. The split makes the right answer obvious: there is no gap. The action is to protect and monitor, and the measured column is what makes that defensible when someone asks why the highest-scoring row has no tasks attached to it.
What to do when a source you do not own controls the answer
Naming a distribution problem is only half a recommendation. Group 2 above contains eight prompts, and for all of them the instinct to publish another owned page is the wrong first move. There are four real options, and only one of them is content.
1. Get into the page that is already winning
If a listicle or independent guide owns the answer, the goal is to be represented favorably inside it. That means outreach: correct an error, supply current specs or pricing, offer data, ask to be included in a comparison. This is public relations and partnership work repurposed, and it is the fastest available win. It is also the option most search teams skip because it does not feel like search.
Best fit: best global CDNs, most reliable edge compute platforms. Both are dominated by roundups where inclusion is an editorial decision, not a ranking one.
2. Become the source that the winning page cites
Look at where the incumbent got its information. If a page is winning on benchmark numbers, pricing comparisons, or performance data, publish the definitive version of that data. You get cited by the citer first, and directly later. Original data is the strongest form of this, which is also why a measurement experiment like this one functions as an asset rather than a blog post.
Best fit: the CPU-time pricing prompt and the SASE comparison prompt. Both turn on specifics a vendor is uniquely positioned to publish.
3. Widen the source set rather than the page count
If one independent site owns the answer, one more owned page will not move it. Five credible third-party appearances might. Analyst coverage, community threads, documentation on partner sites, review platforms, a well-cited developer forum answer. AI answers assemble from a spread of sources, and the goal is to change the spread.
Worth noting from this dataset: youtube.com and reddit.com both appear in Cloudflare's top cited domains across all four weeks. Community and video surfaces are already shaping these answers.
4. Decide it is not winnable and spend the quarter elsewhere
Sometimes the incumbent is a neutral third party that is more credible on that question than any vendor can be, precisely because it is not a vendor. Buyers trust it for the same reason. In that case the honest call is to stop, log the reasoning, and move the effort to a prompt that can be won.
Best fit: the VPN concentrator prompt. Low intent, problem-aware phrasing, and no clear route to owning the answer. Three mentions in Week 4 is not a signal worth a roadmap slot.
Where this model breaks
Three honest limits, since a prioritization model that claims no weaknesses is doing the same thing a composite score does.
| Limit | Why it matters | Current workaround |
|---|---|---|
| Two windows is thin | This scoring compares Week 1 with Week 4. Two points can show direction but not volatility, and one prompt in the set swung from 12 owned citations to 2 with no clear cause | Score direction and absence confidently. Treat single-prompt swings as questions to investigate rather than findings |
| Revenue proximity is unverifiable | Without clean attribution the estimate cannot be checked against outcomes, so it never improves on its own | Label it, flag confidence, and revisit when downstream data exists |
| The judgment does not transfer | Someone inheriting this table sees a finished artifact and follows it, missing the calls that produced it | Keep a decision log of rows where the obvious read and the final action disagreed, with one sentence on why |
How to run this on your own data
The model is brand-agnostic and tool-agnostic. It needs a tracking layer that produces the measured columns and a person willing to state the estimates as estimates.
| Step | What you do | Output |
|---|---|---|
| 1. Establish a baseline | Run the same fixed prompt library across consecutive weekly windows, same market, same engines | A measured baseline that can distinguish a gap from variance |
| 2. Fill the measured columns | Pull mentions, position, total citations, and owned citations per prompt, then calculate owned citation rate | Facts, with a source attached to each |
| 3. Identify the answer owner | For every low owned-citation-rate prompt, open the prompt-level citation list and find which page is winning | The difference between a content gap and a distribution problem |
| 4. Fill the estimated columns | Assign buyer stage, intent, revenue proximity, displaceability, and confidence, writing down the basis for each | Judgment, visibly labeled as judgment |
| 5. Refuse the composite | Do not average the columns. Read them together and write the action by hand | A decision a person made, that a person can defend |
| 6. Log the overrides | Record every row where the obvious read and the final action disagreed, plus one sentence on why | The beginning of transferable judgment |
Related download
Weekly GEO Measurement Starter Kit
The measured columns in this model come from a weekly tracking cadence. The Starter Kit provides the template and instructions for producing that data on any AI visibility tool.
Download the Starter Kit (Word)Why this matters
GEO is at the stage where measurement is improving faster than the judgment applied to it. Tools now produce coverage, share of voice, position, and citation data reliably. What they do not produce, and cannot, is the decision about which gaps are worth an organization's next quarter.
That decision is where the value sits, and it is also where the dishonesty creeps in. A composite score is a way of making a judgment call look like a measurement, and it works right up until someone asks how the number was built.
Keeping the two apart costs a slightly less impressive slide and buys a defensible one. In this dataset it also changed the answer: eight of fifteen prompts that look healthy on mentions are being written by somebody else, and the fix for most of them is not content at all.
Related Proof Lab work
This model connects to the measurement work that produces its inputs and the workflows that act on its outputs.
FAQ
What is the difference between measured and estimated in a GEO priority score?
Measured inputs come from the tracking layer: brand mentions, average position, owned citation rate, which page owns the answer, and stability across pulls. Estimated inputs are judgment: buyer stage, purchase intent, revenue proximity, and whether an incumbent source can realistically be displaced. Both are necessary. Combining them into one number is what causes the problem.
What is owned citation rate and why does it matter?
Owned citation rate is the share of a prompt's total citations that come from your own domains. It matters because it separates being mentioned from being the source. In the Cloudflare dataset, eight of fifteen prompts showed strong mention counts alongside an owned citation rate under 2%, meaning the brand was named in answers built almost entirely from other people's pages.
How do you tell a content gap from a distribution problem?
Compare mentions with owned citation rate. High mentions plus a low owned citation rate is a distribution problem: the brand is in the answer but is not supplying it, and publishing another owned page rarely changes which source gets retrieved. Low mentions plus low citations is a genuine content gap. The two require different teams and different budgets.
What should you do when a third-party page owns the AI answer?
There are four options and only one is content. Get represented inside the page that is already winning through outreach. Become the source that page cites by publishing the underlying data. Widen the source set through analyst, community, partner, and review surfaces. Or decide the answer is not winnable and spend the quarter elsewhere. The choice depends on why the incumbent is winning: freshness, neutrality, or depth.
Why is revenue proximity always an estimate in GEO?
Because AI-referred traffic is poorly instrumented. Much of it arrives as direct, and delayed branded search from an AI answer is attributed to branded search rather than AI influence. Any revenue figure attached to a citation gap is an inference and should be presented as one.
Can this prioritization model be used with any AI visibility tool?
Yes. The measured columns require a tracking layer that reports brand mentions, position, total citations per prompt, and citations by URL. Otterly.AI, Profound, and comparable platforms produce those inputs. The model itself is tool-agnostic.